
- Code implementation and improvements in its application
- CYPECAD
- Improvements in post-tensioned slab drawings
- Export bill of quantities of the structure with the Price generator of Mali
- CYPE 3D
- Unification of force viewing tools
- Stress diagram representation using contour lines
- Drawing preferences – View options
- Drawing speed optimisation
- Improvements in the representation of shell integration strips
- 3D window of a selection of elements
- Copy panels with surface loads
- Analysis without checking bars
- CYPE 3D and CYPE-Connect
- CYPECAD MEP
- CYPETHERM ASHRAE LOADS
- Arquimedes
- Generation of keynote files for Revit
- Keynote reports for Revit
- Copy cell, column and table content in Arquimedes
- Import CSV quantity files
- Group quantity lines
- Return to the 2015 version download area
Code implementation and improvements in its application
This code was already implemented in CYPECAD, CYPE 3D and other CYPE programs as of previous versions. Recently, with the 2015.e version, it became part of the group of codes that can be used to carry out punching shear verifications in accordance with code criteria. ![]()
Now in the 2015.f version, when the NTCRC:2004 code of Mexico is selected in CYPECAD as the concrete code, beams are edited with the advanced beam editor and columns with the advanced column editor. This implies important improvements in the application of these codes:
- Detailed U.L.S. and S.L.S. check reports for concrete beams and columns (including torsion checks)
- U.L.S. and S.L.S. reports for steel beams and columns
- Diagrams and numerical values for necessary and effective steel areas
- Bar bending diagrams and reinforcement layout configurations in frame drawings
- Design of variable depth concrete beams
- And, generally, provides a quick and comfortable graphical interface to edit the resistant elements of the frame (reinforcement bars, lattices etc.)
If a seismic analysis is carried out, the NTCRC:2004 code is compatible with a group of seismic codes, but it is only with the NTC-2004 code that the advanced column and beam editors of CYPECAD can be used and take into the account its criteria for the capacity design in the design of concrete columns and beams.
More information can be found in the section on the “Advanced beam editor” of CYPECAD in the concrete beams webpage. ![]()
The concrete and seismic codes for which CYPECAD takes into account capacity design criteria for concrete columns and beams can be seen in the “Capacity design criteria for seismic design of concrete columns and beams” section of the CYPECAD webpage. ![]()
More information can be found in the section on the “Design codes available for use with the Advanced beam editor” in the webpage dedicated to concrete beams in CYPECAD. ![]()
In the section on “Programs which generate U.L.S. check reports”, more information can be found on the codes that are available for CYPECAD’s advanced column editor. ![]()
Code regarding loads on structures. Seismic loads
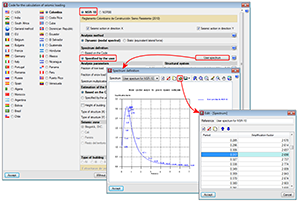
This code was already implemented in previous CYPECAD and CYPE 3D versions. Now, in the 2015.f version the possibility has been added to define a user seismic spectrum.
A design spectrum must be defined to carry out a seismic analysis of the structure. Each earthquake-resistant code provides the criteria that are to be applied within a specific territory when considering seismic action in a project. Nonetheless, users may opt to, under their responsibility, apply other criteria to those established in the code. The program offers, for this seismic code, different ways to proceed, to contemplate both possibilities. The seismic spectrum can be:
- Calculated in accordance with that specified in the seismic code to be applied.
- Specified by users based on their own criteria.
CYPECAD
Improvements in post-tensioned slab drawings
The following are now indicated in post-tensioned slab drawings:
- The minimum and maximum points of the path of the tendons, as well as their inflexion points
- The height of the anchors is included
- The drawing includes:
- The distance between the base of the formwork and the bottom part of the duct.
- The spacing between reference lines is 1 m.
- The height of the anchors is the height measures from the base of the formwork to the axis of the tendon.
Export bill of quantities of the structure with the Price generator of Mali
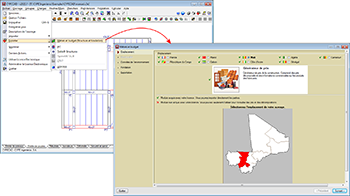
As of the 2015.f version, CYPECAD can generate the bill of quantities of the concrete structure that has been analysed taking into account the job items and prices of the Price generator of Mali. To do so, users must install CYPECAD in French and the job must be analysed in accordance with one of the following concrete codes:
- Eurocode 2 (France)
- Eurocode 2 (EU)
- BAEL-91 (R-99) (France)
Using this new implementation, CYPECAD can generate the bill of quantities with the following Price generators:
- Price generators in French (Algeria, Cameroon, France, Gabon, Ivory Coast, Mali, Morocco, Republic of Congo, Senegal)
- Price generators in Spanish (Argentina, Chile, Colombia, Mexico, Peru, Spain)
- Price generators in Portuguese (Angola, Brazil, Cape Verde, Mozambique, Portugal)
For CYPECAD to be able to export the bill of quantities, the user license must be able to connect with the corresponding Price generator.
CYPE 3D
Unification of force viewing tools
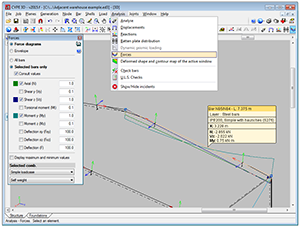
The force viewing tools available in earlier versions of CYPE 3D (Analyse > Forces, Envelopes, Forces at a point and Envelopes at a point) have been unified in a single option (Analyse > Forces) and opens the Forces dialogue box.
The new “Forces” dialogue box allows users to consult force diagrams and envelopes at the selected point and to view the maximum and minimum forces of bars. Values can be displayed at the selected point by moving the cursor along the bar. The “Selected bars only” and “Consult values” options must be selected beforehand.
This window also allows users to assign the scale the force diagrams are to be represented in and select the loadcase or loadcase combination for which the forces are to be displayed.
For users, this represents a substantial improvement regarding the time required to use the option, since there is no need to change tools depending on which type of consultation is to be done.
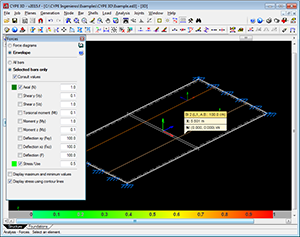
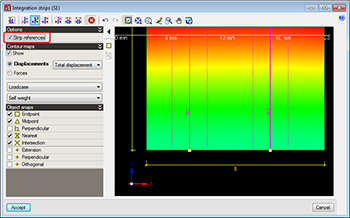
Stress diagram representation using contour lines
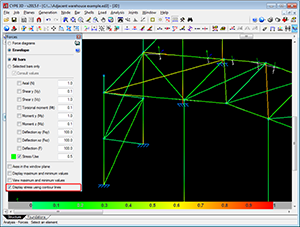
The option: Draw stress using contour lines has been included in the new Forces dialogue box of the Analysis menu. This option appears in the “Forces” dialogue box when the “Envelopes” option in the same dialogue box has been activated, and once it has been activated, its effects can be seen when the option “Stress/Use” in the same dialogue box is selected.
By activating the “Draw stress using contour lines” option (meeting the conditions indicated in the previous paragraph) the stress or use factor of the bars is represented on-screen using a colour scale varying from green to red. This representation is carried out for all the bars of the structure if the option “All bars” is activated or only on the selected bars if the option “Draw stress using contour lines” is activated.
Bar spans that do not meet the stress requirements are displayed with a more intense red without differing them from those whose use factor is at 100%. In either case, to see which bars fail the stress requirements, the option: “Draw stress using contour lines” should be activated, which will display the stress distribution of each bar and show those in green whose the use factor does not exceed 100% and in red those that do.
This graphical representation using a colour scale provides a quicker results interface for user to view the use factors of the bars of the structure.
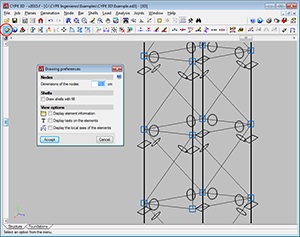
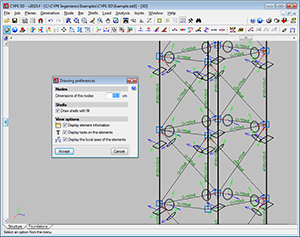
Drawing preferences – View options
The following options have been included in the View options section in the Drawing preferences dialogue box (Job > Drawing preferences):
- Display element information
Activates and deactivated the tooltip which appears providing information on the element, associated with the active option, on which the cursor is placed (e.g. “Describe section” in the Bar menu). - Display texts on the elements
Activates and deactivates texts being drawn on-screen over the elements. - Display the local axes of the elements
Activates and deactivates the local axes of the elements being drawn on-screen.
Until the 2015.f version, the local axes of the bars or shells, the indicative texts on the elements and information tooltips on bars with specific program options, appeared automatically without the option to hide them. Occasionally, due to overlapping, these items hindered the view of the structure. As of the 2015.f version, users can activate and deactivate these views and so improve their perception of the structure.
The speed with which the bars and diagrams are drawn in the program has been optimised. This improvement is more noticeable with large structures, where in previous versions, the image slowed down when it was moved, zoomed into or out of, in the active window.
Improvements in the representation of shell integration strips
In previous versions, integration strips defined on shells to consult forces could not be represented on drawings neither was a reference or information on the width of each strip available.
As of the 2015.f version, the integration strips can be added in the shell drawings. These integration strips will appear with their reference in the strip editing window, on drawings and in tooltips. Furthermore, information regarding the width of each strip has been added in the forces report.
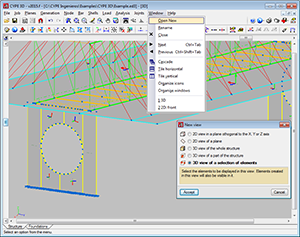
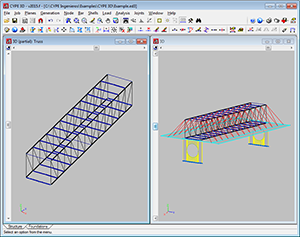
3D window of a selection of elements
As of previous versions, users can create windows to work with all the structure in 3D, part of the structure in 3D included in an orthogonal parallelepiped defined by its diagonal, or in 2D corresponding to selected planes.
As of the 2015.f version, users can create 3D windows of a selection of elements (Window > Open new > 3D view of a selection of elements). Upon selecting this option, users can select nodes, bars and shells; one element at a time or using a capture window. As well as selected bars, the following elements will also appear in 3D windows created in this manner:
- Bars, even though they have not been selected, whose initial or final node also belong to the selected bars.
- Bars which have been introduced in the 3D window.
As occurs in any 3D or 2D window, bars that are introduced in 3D windows of a selection of elements generate intermediate nodes at intersection points with other bars only if the option: “Generate nodes at intersection points” (Bar menu); even if these bars are not included in the window.
3D windows created using a selection of elements allows users to work in an isolated manner on part of the structure without having to view the complete structure.
Copy panels with surface loads
As of the 2015.f version, when a panel is copied (Job > Copy elements) , all the surface loads applied on the copied panel are also copied automatically. In previous versions, copying a panel did not imply that its surface loads would also be copied, unless the option to copy the surface loads was activated.
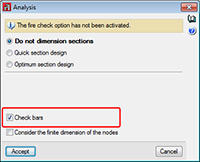
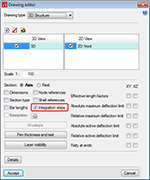
Analysis without checking bars
In the 2015.f version, checking bars is an analysis option, and so, users can analyse the structure with or without checking bars. In previous versions, when the job was analysed, bars were checked and users did not have the option to analyse to simply obtain forces.
As of the 2015.f version, results which depend on bars having been checked will not be available if the option “Check bars” has not been activated. By including this option, the use of the program has been optimised especially in the early design stages of the structure where users do not wish to check sections but rather know how the structure behaves and how the forces are distributed.
CYPE 3D and CYPE-Connect
Connections with eccentricity between webs
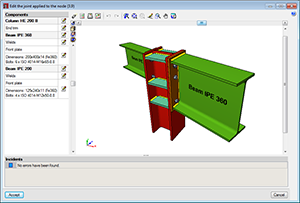
As of the 2015.f version, welded and bolted I-section column-lintel connections designed and checked in CYPE 3D and CYPE-Connect, can have slightly eccentrically aligned webs. Both programs can design these connections whilst the projections of the webs of the column and lintel overlap in a plane perpendicular to that of the webs’.
Connections at an angle on plan
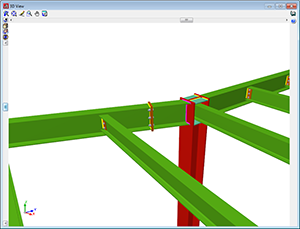
As of the 2015.f version, some types of welded and bolted I-section beam-beam and beam-column connections can be designed and checked in CYPE 3D and in CYPE-Connect when beams reach the web of the other beam, or to the flange or web of columns and are not at a right angle on plan.
The maximum permitted angle will depend on whether the connection can be executed (space available to place bolts) and on design standard limitations (effective weld angle).
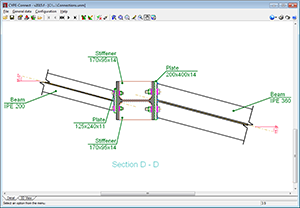
Below are the types of connections for which this angle can be used (for both welded and bolted connections):
- Beam – column flange moment connections
- Beam – column web moment connections
- Beam – column flange simple connection
- Beam – Column web simple connection
- Beam – beam simple connection
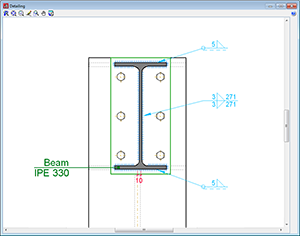
The connection details drawing includes an on-plan view, the angle of the beams with respect to the plane orthogonal to the surface connecting to the column or beam.
CYPECAD MEP
Edit individual linear thermal bridges
Thermal bridges included in thermal envelope of the building are automatically identified when the analysis is carried out (Results > analyse) from the Air Conditioning tab of CYPECAD MEP, by analysing the elements that have been introduced.
Now, with the 2015.f version, users can modify the linear thermal transmittance and internal surface temperature (this latter parameter is only specified in CYPECAD MEP for Spain) of a thermal bridge.
Having chosen the “View thermal bridges” option (Results menu or ![]() button, which analyses the job and displays the edges of the thermal bridges that have been detected), users can edit the values that have been calculated for each thermal bridge by selecting an edge (linear transmittance and, for CYPECAD MEP for Spain, also the internal surface temperature factor). The editing process can be done using the following buttons or using the corresponding options in the “Results” menu:
button, which analyses the job and displays the edges of the thermal bridges that have been detected), users can edit the values that have been calculated for each thermal bridge by selecting an edge (linear transmittance and, for CYPECAD MEP for Spain, also the internal surface temperature factor). The editing process can be done using the following buttons or using the corresponding options in the “Results” menu:
 Displays the calculated values or values assigned to the selected edge (present in previous versions)
 Allows users to edit the calculated values or values assigned to the selected edge (present in previous versions)
 Copies the values assigned to the thermal bridge of the selected edge (new option):
- Select the edge of the thermal bridge whose properties are to be copied. This option only copies the properties of thermal bridges that have been modified by users, and so has no effect if the edge of a thermal bridge that has not been modified is selected.
- Using the left mouse button, click on the edge of the thermal bridge to which the properties copied in the previous step are to be assigned. Several thermal bridges can be assigned these properties by selecting them one by one.
- Click on the right mouse button to confirm the copy.
 Deletes the values assigned to the thermal bridge by users, by selecting one of its edges (new option). This thermal bridge will then have the properties calculated by the program. This option will never delete the values calculated by the program.
The edges of the modified thermal bridges are displayed with a dot at their centre.
When an edge belonging to a thermal bridge which affects two or more air conditioning precincts is selected, for example, at the intersection between the façade and floor slab between two floors, users can only see the edge belonging to the floor which is currently displayed on-screen. Nonetheless, the thermal bridge is being edited, and so the value of the linear transmittance is divided amongst the number of edges the thermal bridge contains. For the aforementioned example, the dialogue box indicates “Linear transmittance (ψ = ψ1 + ψ2)”. Furthermore, if the value assigned to either of the two edges is displayed (using the ![]() button), the value that is indicated is half of what was introduced in this case. Both edges , the selected edge and the one belonging to the same linear thermal bridge, are represented graphically with the point that identifies them as an edited edge.
button), the value that is indicated is half of what was introduced in this case. Both edges , the selected edge and the one belonging to the same linear thermal bridge, are represented graphically with the point that identifies them as an edited edge.
These thermal bridge parameters are defined by introducing their numerical values. In CYPECAD MEP for Spain, they can also be defined by selecting a thermal bridge amongst the types defined in the LIDER library and in CYPECAD MEP for France, users can select a thermal bridge from the library of the RT 2012 code.
For the LIDER library, each predefined type contains a linear transmittance and an Internal surface temperature factor defined by LIDER and can be seen in the selection dialogue box. The values LIDER adopts for each type of thermal bridge only contemplate the geometrical position of the thermal insulation. The materials making up the construction elements are not taken into account, and so the values of the Linear transmittance and the Internal surface temperature factor defined by LIDER are approximate.
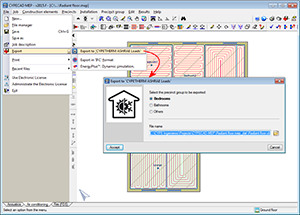
Export to CYPETHERM ASHRAE LOADS
As of the 2015.f version, CYPECAD MEP allows users to export jobs to CYPETHERM ASHRAE LOADS from the “Air conditioning” tab. If more than one precinct group has been defined, users have to select the group to be exported to CYPETHERM ASHRAE LOADS. In upcoming program versions, users will be able to export the complete job regardless of the number of precinct groups it contains.
RT 2012. Thermodynamic generators in the EDIBATEC database
Included in previous versions were deposits, heaters, wood heaters, gas/fuel heaters and heaters of the EDIBATEC database. Now, in the 2015.f version, thermodynamic generators for the RT 2012 code of this database have been incorporated.
CYPETHERM ASHRAE LOADS
As of the 2015.f version, CYPECAD MEP allows users to export jobs to CYPETHERM ASHRAE LOADS from the Air conditioning tab, as has been indicated in the new features of CYPECAD MEP. ![]()
Arquimedes
Generation of keynote files for Revit®
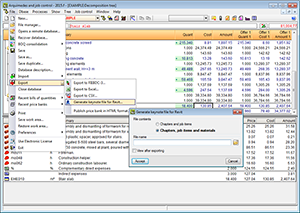
As of the 2015.f version, Arquimedes generates keynote files for Revit® (CAD-BIM program). To do so, the option: Generate keynote file for Revit (File > Export) has been generated. This option opens a dialogue box where users can choose between two export types:
- Chapters and job items
Creates a “txt” file containing the keynotes for Revit. The file contains a list of keynotes consisting of the value of the keynote and the text of the keynote for each chapter and job item of the database. Each chapter and job item concept have a reference to the immediate higher level on which they depend so that Revit can create the decomposition tree composed of chapters and job items. - Chapters, job items and materials
Creates a “txt” file containing the keynotes for Revit. The file contains a list of keynotes consisting of the value of the keynote and the text of the keynote for each chapter, job item and material of the database. Each chapter, job item and material concept have a reference to the immediate higher level on which they depend so that Revit can create the decomposition tree composed of chapters, job items and materials.
If materials are included in the decomposition of a job item of the bill of quantities, these will be displayed hung from the job item that is using them in the keynotes. There is one exception to this however. Since Revit does not allow for keynotes to be repeated, if the materials are used by more than one job item in the bill of quantities, i.e. they are repeated, in the keynote file, the first job item which contains them will display the keynote of these materials. The following job items which use the same material will appear without the materials but immediately following each job item will be a job item with their same reference with the word “_Material” added to it. The text of this duplicated job item only contains the codes or keys of the repeated materials. This way, Revit can display keynotes containing materials and can be located easily. Contained in the bottom part of the Revit keynotes window, is the complete text of the keynote. Users can copy the value of the keynote from this zone to the clipboard of the operating system to later use wherever it may be required.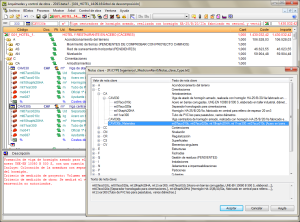
The final use of the Revit keynote file is to be able to identify construction elements and measure and tag materials in construction details.
Two new report templates have been implemented in Arquimedes. These templates can also be found in the new template type called “Revit”. The two new templates are:
- Template 00 – Keynote Revit (pl_exp01.pla)
Contains chapters and job items. They refer to the level immediately above them and to which they belong. It displays a list of job items classified by chapters as they appear in the bill of quantities. - Template 00 – Keynote Revit Materials (pl_exp02.pla)
Contains chapters, job items and materials. They refer to the level immediately above them and to which they belong. It displays a list of materials classified by job items and chapters as they appear in the bill of quantities.
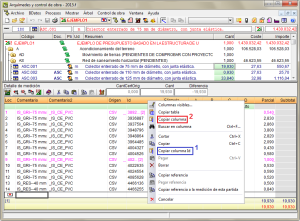
Copy cell, column and table contents in Arquimedes
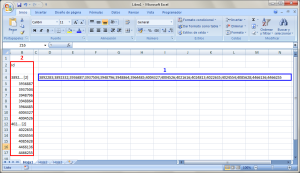
The 2014.f version includes new options to copy the contents from the workspace (Decomposition tree, Concept list, Chapter hierarchy and Quantities / Certifications) and quantity tables (budget, sales, study, execution and certification tables), such as specific data contained in cells, lines and tables. With these options, users can then paste the information in Excel or any other application to which information can be pasted from the clipboard of the operating system. Information is copied in the following way:
- Copy from the workspace
The contents of a cell, column or table in the workspace can be copied to the clipboard using the following options: - Copy cell
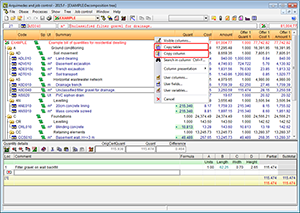
This option is found in the context menu that appears by clicking with the right mouse button on a cell in the workspace. It copies the contents of the cell to the clipboard of the operating system. - Copy table
This option is found in the context menu that appears by clicking with the right mouse button on the header of the window of the workspace and will copy the complete table to the clipboard of the operating system. The “Copy column” option can also be found in the same context menu. - Copy column
This option is found in the context menu that appears by clicking with the right mouse button on the header of the window of the workspace and will copy the column where the mouse cursor is at, to the clipboard of the operating system. The “Copy table” option can also be found in the same context menu. - Copy from quantity tables
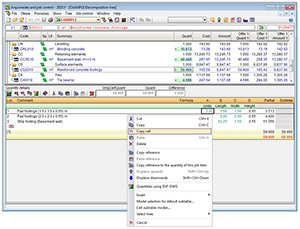
The contents of a cell or column of a quantity table can be copied to the clipboard using the following options: - Copy cell
This option is found in the context menu that appears by clicking with the right mouse button on a cell of a quantity table (budget, sales, study, execution or certification table). It copies the contents of the cell to the clipboard of the operating system. - Copy table
This option is found in the context menu that appears by clicking with the right mouse button on the header of a quantity table (budget, sales, study, execution or certification table) and will copy the complete table to the clipboard of the operating system. The “Copy column” option can also be found in the same context menu. - Copy column
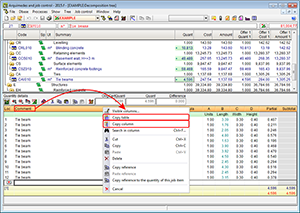
This option is found in the context menu that appears by clicking with the right mouse button on the header of the quantity table (budget, sales, study, execution or certification table) and will copy the column where the mouse cursor is at, to the clipboard of the operating system. The “Copy table” option can also be found in the same context menu. This option has a special feature when executed on quantity tables with grouped lines. These tables contain a column labelled “id”. By clicking on the header of this column with the right mouse button, two copy options will appear: - Copy column
Copies the column as is it seen in the quantity table in Arquimedes. - Copy column id
Copies the complete contents of the id field of the grouped quantities of a cell or column. On the other hand, if the Caps Lock button is pressed at the same time as the right mouse button is pressed on the cell of an id or on the header of an id column and the option Copy column id is selected, the program will ask for the configuration of the contents to copy.
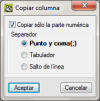
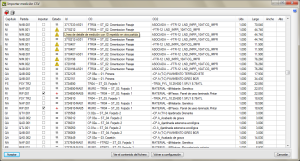
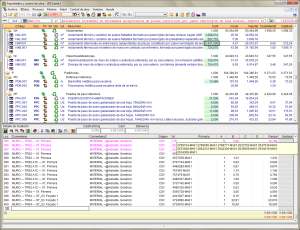
Improvements for importing CSV files have been implemented. When a quantity CSV file is going to be imported, Arquimedes warns there may be repeated ids and does not import them. The warning is emitted by displaying an icon: ![]() . Lines marked with the
. Lines marked with the ![]() icon cannot be marked in the Import column to confirm they are to be imported.
icon cannot be marked in the Import column to confirm they are to be imported.
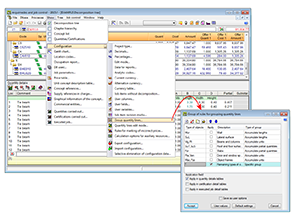
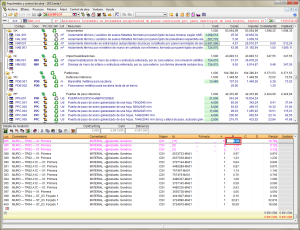
In previous versions, quantity lines had to be grouped using the “Group quantity lines” option (Show > Configuration). This option allows users to define rules to be applied when grouping details lines of quantity tables (on-screen, when printing or exporting). Grouping of quantity details lines is applied to lines imported from CAD/BIM files, from BC3 files and those introduced by users. The type of objects to be grouped is a list of quantity line type identifiers separated by commas. A quantity line type identifier is the non-numerical part of the unique identifier associated with each quantity line and imported from an XCA file (“Id” column). An asterisk (*) can also be used as an identifier to represent the remaining types. For Revit, ArchiCAD or a manually measured quantity, the group has to be for asterisk type * objects since the id does not identify the type of object to which the quantity belongs to.
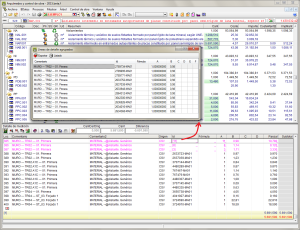
To improve this process, as of the 2015.f version, when a quantity is imported in CSV format, the contents of the tables are organised depending on the “Comments” and “Comments2” fields. This way an order is established once the association is viewed in the quantity tables.
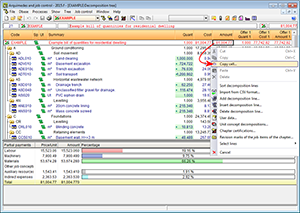
Once this type of line grouping has been accepted, lines which meet this condition will be grouped and, in the Decomposition tree window, will be shown in magenta. The number of grouped lines and their individual id is displayed. Furthermore, by double clicking with the mouse button on the grouped id, a window will open showing the grouped lines.
Fields which are not added in the group can be edited to change the data and affect all the grouped lines.
Return to the 2015 version download area
Tel. USA (+1) 202 569 8902 // UK (+44) 20 3608 1448 // Spain (+34) 965 922 550 - Fax (+34) 965 124 950